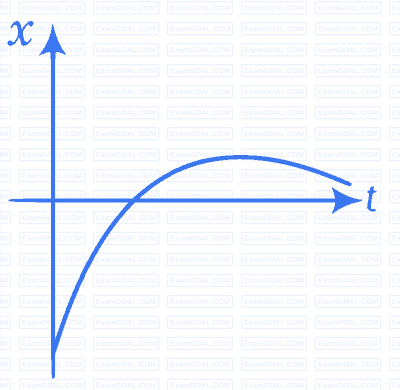
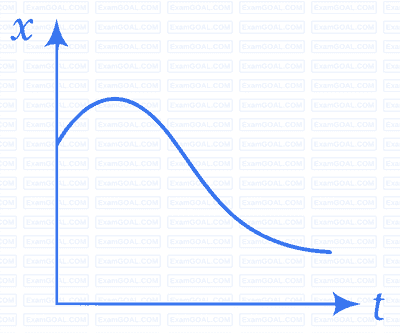
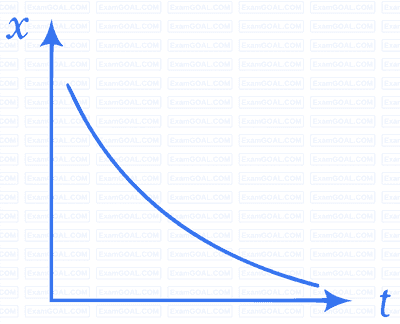
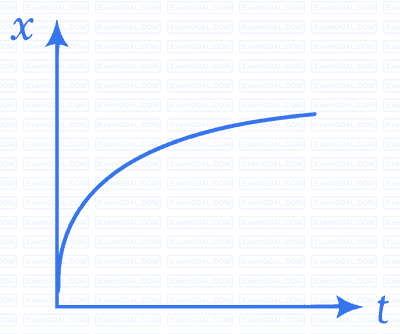
Among the four graphs shown in the figure, there is only one graph for which average velocity over the time interval (0, T) can vanish for a suitably chosen T. Which one is it?
A lift is coming from 8th floor and is just about to reach 4th floor. Taking ground floor as origin and positive direction upwards for all quantities, which one of the following is correct?
$x < 0$, $v < 0$, $a > 0$
$x > 0$, $v < 0$, $a < 0$
$x > 0$, $v < 0$, $a > 0$
$x > 0$, $v > 0$, $a < 0$
In one dimensional motion, instantaneous speed $v$ satisfies $0 \leq v < v_0$.
The displacement in time $T$ must always take non-negative values.
The displacement $x$ in time $T$ satisfies $- v_0 T < x < v_0 T$
The acceleration is always a non-negative number.
The motion has no turning points.
A vehicle travels half the distance $l$ with speed $v_1$ and the other half with speed $v_2$, then its average speed is
$(v_1 + v_2)/2$
$(2v_1 + v_2)/(v_1 + v_2)$
$2v_1v_2/(v_1 + v_2)$
$(l(v_1 + v_2))/v_1v_2$
The displacement of a particle is given by $x = (t-2)^2$ where $x$ is in metre and $t$ in second. The distance covered by the particle in first 4 seconds is
4 m
8 m
12 m
16 m